Thermochron Software
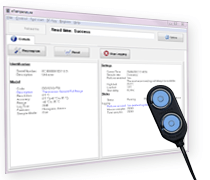
eTemperature is an easy to use and extremely powerful program that helps you analyse the results from your Thermochron Temperature Logger, create reports, and so much more. This means you can know exactly what the temperature of an area was at any time you were logging.
 |
Step 1 Connect your Thermochron logger via USB, and set parameters such as the logging interval. |
 |
Step 2 Place your Thermochron in the location, and wait for it to gather results |
 |
Step 3 Connect your Thermochron back to the computer. You can now download and analyse the results. |
Why use eTemperature?
| Easy Configuration eTemperature provides very quick and simple configuration of loggers. This includes “Fast Start” buttons that will automatically set the values for applications such as storing food, vaccines and frozen goods. Of course, these buttons can be customised to suit your own needs. | |
Easy Results & Reporting Once you have downloaded the results from your logger there are many tools to make the most of the data such as
Reports can easily be printed, saved as PDF or emailed. These reports can include the graph, the settings, the readings, and daily min / max. There is also built in intelligence, allowing you to get the results which only exceed your reporting thresholds. This means you don’t need to see the data where there isn’t an issue.
|
|
| A picture is worth a thousand words… For eTemperature, a graph is worth thousands of readings. See weeks or months worth of data at a glance. Zoom in on a section. Move it about. But there is even more. Colour coding to highlight trouble. A cursor to show you the date and temperature. Click on a point to find it in the table. Copy it to the clipboard to paste into a report. It is all so easy. | |
| Free Updates. No subscription fees. No upgrade fees. So if a feature is available in a new version, then it’s yours – free. |
Find out more about eTemperature »
For more information, tutorials, manuals and videos visit eTemperature.com.au

